Measuring Key Performance Indicators

Measuring Key Performance Indicators with Dashboards
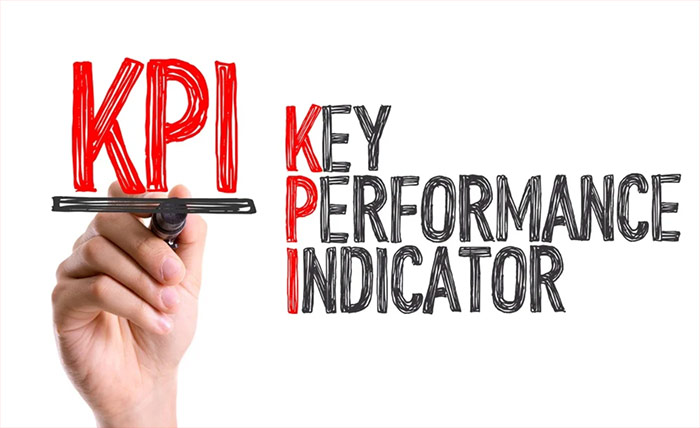
To remain profitable while staying competitive, many construction companies are turning to business intelligence tools to optimize the management of their projects. Two of these tools are Key Performance Indicators (KPIs) and Dashboards.
KPIs are measurements, or metrics, that are used to quantify your company’s performance in a variety of areas. KPIs can be financial or non-financial and indicate whether your company is meeting its goals. Dashboards facilitate the monitoring of KPIs by providing high level information summaries, often with drilldown capabilities, that measure various aspects of your company’s overall health.
The Construction Profit Problem
Because construction companies typically have low profit margins, fixed contract prices and long payment terms, it would be difficult for a start-up company to “sell” their vision to a venture capitalist. Here’s how the pitch might sound:
“I want to start a company with fixed priced contracts that only allow additional payment if the work being done is out of the originally scope. I won’t get paid on projects for up to 90 days – or more. The profit will be somewhere from three to 10 percent and I will have to pay material suppliers, subcontractors, laborers and general administration costs before getting paid on some projects.” .
Doesn’t sound like a very attractive investment, does it?
The truth is, some of the most financially successful people I know are in the construction industry. But getting – and staying – at the top of the construction profession requires business intelligence. Success comes from setting goals and using tools such as KPIs and Dashboards to monitor company performance.
How KPIs and Dashboards Protect Profitability
If a project’s profit is based on good estimating and completing the project on or under budget, it is essential to monitor estimated cost vs. actual cost throughout the job’s progress. If your goal is to make a 10 percent profit on this project, even minor cost overruns that aren’t caught (and corrected) early will chip away at your margin.
By monitoring the estimated vs. actual cost KPI for the project using a Dashboard that displays – in real time – its estimated cost, actual cost and cost variance in an easy to read graph, you will know in moments whether or not that job is on target to reach its 10 percent profit goal.
Imagine the business intelligence and control you will gain over company profitability when you use this one KPI and Dashboard to consistently measure the status of all jobs across your organization! And this is just one example of performance measurement.
Consistently using multiple KPIs and Dashboards to measure construction management aspects such as committed cost, cash flow, change order status, profit and loss, over/under billings, cost by category and accounts receivable analysis will allow you to identify profit-sabotaging trends so you can take action to ensure success.
Search
Subscribe to Our Blog
Enter your information to subscribe to the blog.
Recent Posts
-
Positive Pay Solution for AccuBuild Customers May 12, 2022
-
AccuBuild 2021 User Conference August 12, 2021
-
3 Ways AccuBuild’s Systems Work With You on The Go August 05, 2021


